Student Onboarding Experience
Web/Responsive // Application: Figma
Role: UX Designer
Responsibilities: End-to-end design, Accessible design
Team: 1 UX Designer, 1 UX Researcher, 1 Product Manager, Software Engineers, 1 Systems Analyst
Objective: Create a seamless journey for students, starting with understanding what they need to purchase, then selecting the best plan, and finally accessing their materials on the dashboard, in order to streamline the process and reduce support calls and tickets.
Challenges: For the onboarding with the grid design, students were overpaying by 20%, refunds increased 20% with 48% of those refunds due to “purchased wrong product” and there was an increase in time it took for the user to figure out what they needed.
For the dashboard, students were having to parse through all the cards to find what they were looking for and it was hard to determine what was an ebook vs. courseware vs. additional materials (shown below). We wanted to come up with a way to solve for these two major pain points along with making the whole journey flow a little easier for the student.
Purchasing Options

Old purchasing design
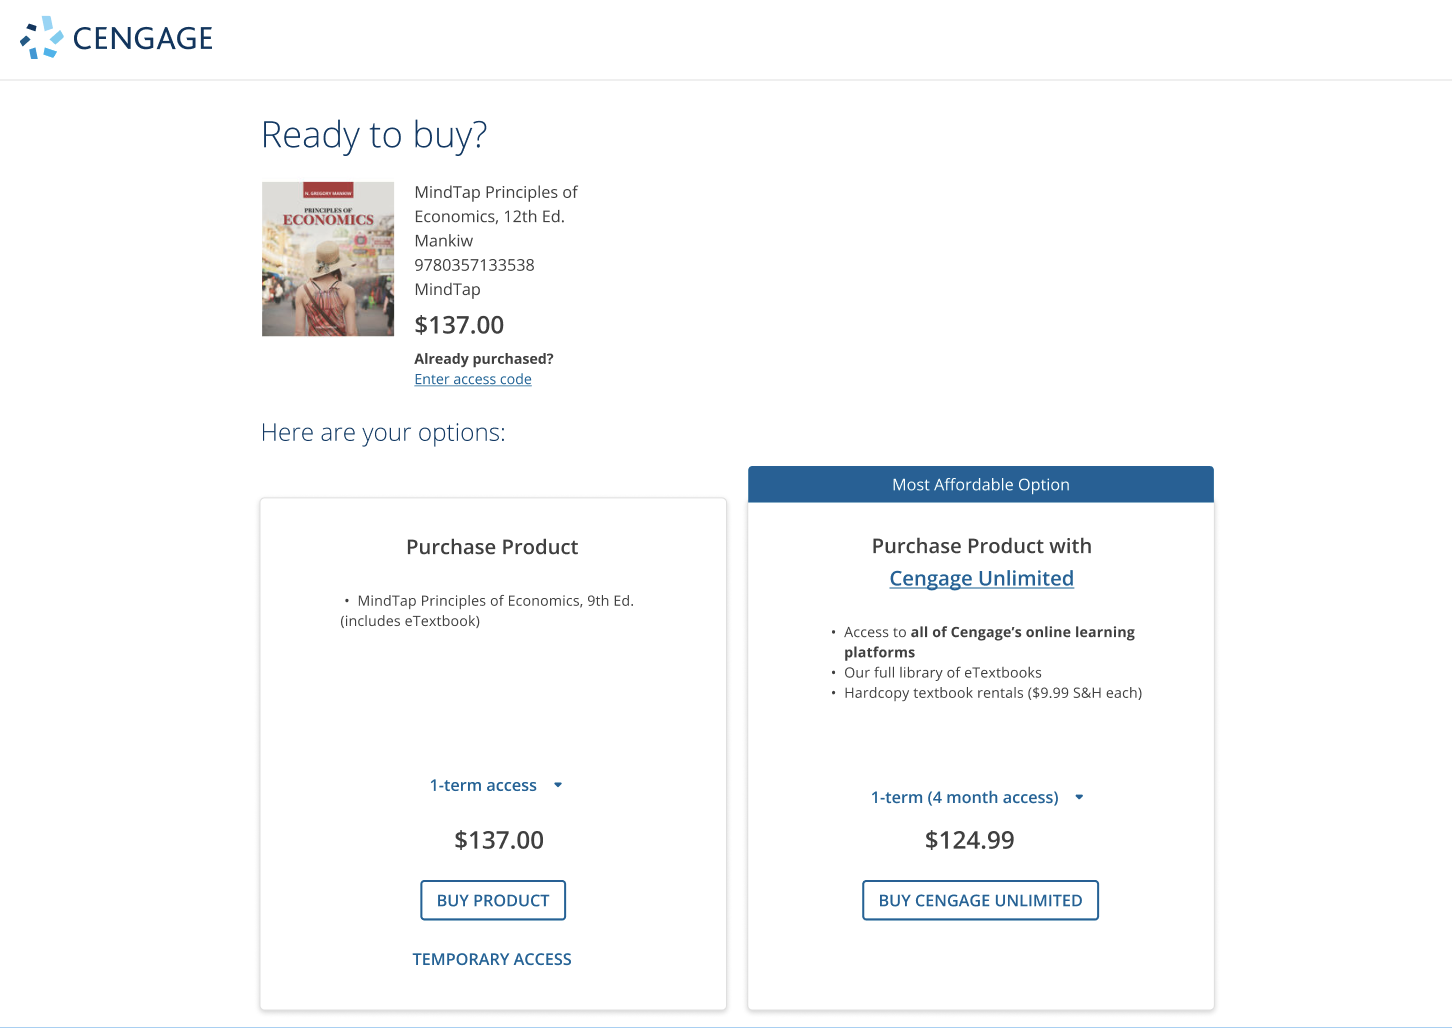
Final design for the purchasing flow to help make an informed decision
Dashboard

Old Dashboard with multiple tiles for one product and little organization

New dashboard redesign with the consolidated tiles
Design Process
This process ensures that we identify the right problem before jumping into solutions. By starting with research, we gain the insights needed to define the problem accurately. From there, we ideate and test, cycling through multiple iterations until we’re confident we’ve found the most effective solution. This iterative approach allows us to balance timeliness with creating meaningful, user-centered outcomes.
Research & Understand —> Ideate —> Test —> Refine —>Implement
Design Sprint and Low Fidelity Designs: After engaging with students and gathering feedback from support teams, the researcher, product manager, systems analyst, marketing team, and customer support representatives and I came together for a design sprint. This sprint helped us align on goals and brainstorm initial solutions to the problems we identified. We collaborated on sketches and discussed our ideas, which allowed me to create low-fidelity designs. These designs were then used for quick user testing to gauge student reactions and gather valuable feedback.
Design Sprint
How might we… communicate our purchasing options to students so they can feel confident in their purchasing decisions.
In two years… calls and support tickets will decrease 30% and we will have built trust with our students.
Share some inspiration and then sketch some initial solutions
Vote on the sketches
Winning sketches are taken and then I (as the designer) create low fidelity designs that we tested with 5-10 students to get some initial reactions
These reactions are then taken back and discussed about what worked and what didn’t work and then we collaborated with engineering to see what was technically feasible

This shows some of the deliverables from the design sprint. We met for two days to work with the team to align on pain points and come up with some solutions that could solve the problems. These low fi designs were shown to students to get some initial thoughts and then iterated on further. Some of the ideas here we had to change because of technical constraints once we showed these to the development team.
Final Designs: I used this feedback to collaborate with the product manager and development team, refining the designs into high-fidelity versions that adhered to technical constraints. Additionally, I partnered with the researcher to conduct usability testing, ensuring that these designs effectively enhanced the student experience. When we felt confident they did, the designs were passed to engineering for prioritization and refinement.

This shows the updated onboarding flow that takes you into the dashboard. The new dashboard is to the right and next to it is the old one. There were also updates to the brand during this project so the first screen has the old branding that will hopefully be updated eventually. Also part of the checkout flow is signing in and adding your information that was not part of this project.